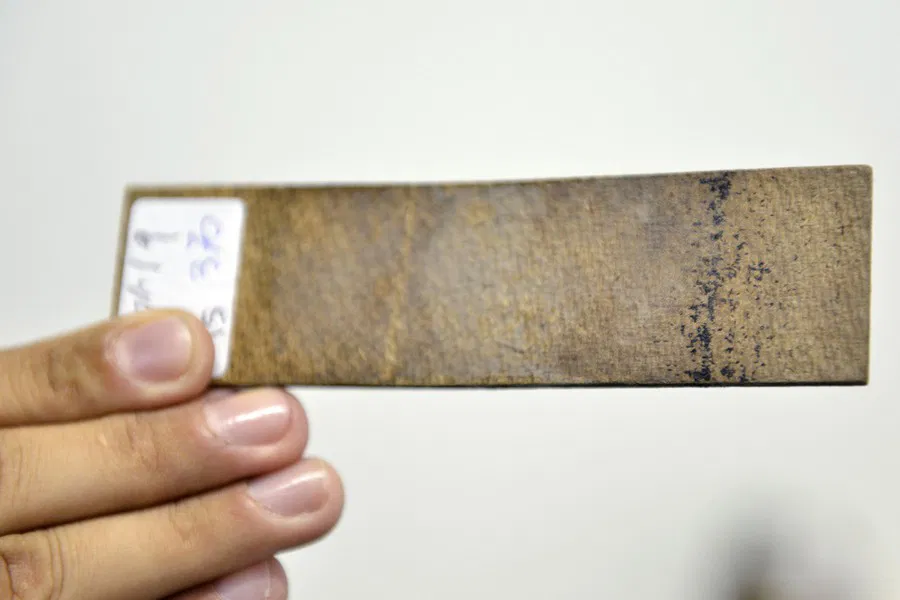
How many eggs does this straw contain?
Send result nowWho are we?
Conta Ovos is an application created from the efforts of Fiocruz, CEFET-RJ and Mosqlimate (FGV) to optimize the egg count of Aedes aegypti. Its implementation in municipalities is being supervised by the Ministry of Health with the intention of absorbing its structure in the future.
The amount of time dedicated by trained professionals to counting eggs is immense and we intend to reduce this time tremendously by promoting an effective count, in addition to producing heat maps of the number of eggs per municipality that allows health professionals to direct their actions.
Time is priceless. We hope that the time saved by this application will allow these professionals to dedicate themselves to more prevention and monitoring practices in addition to counting and managing the number of eggs.
Manual
O aplicativo possui um manual para fácil entendimento. Abaixo poderá fazer download dele:
Click here to download the manualWhat the application proposes
To log into this application, you must be invited by a public agent. After logging in, you will be able to:
- Register ovitraps in your group
- Launch the number of eggs per pick
- Access real-time map with egg distribution
About the map
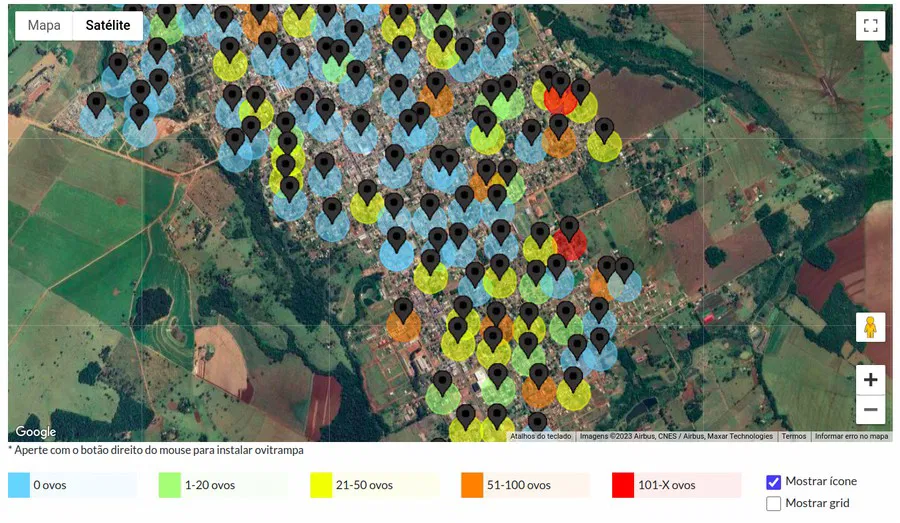
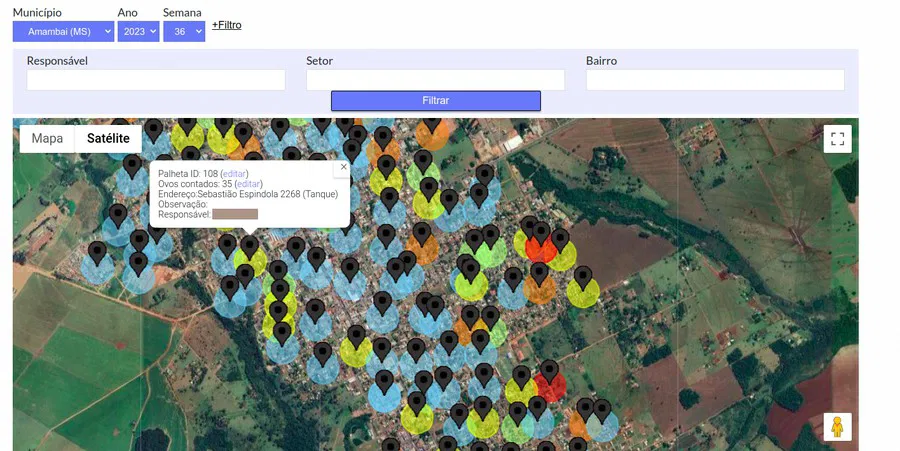
After logging in, you will be able to see the map option, where you will see your municipality and the distribution of eggs. An example of what this distribution would look like is seen below, where blue dots are negative ovitraps (without the presence of eggs) and red dots are ovitraps with more than 100 eggs.
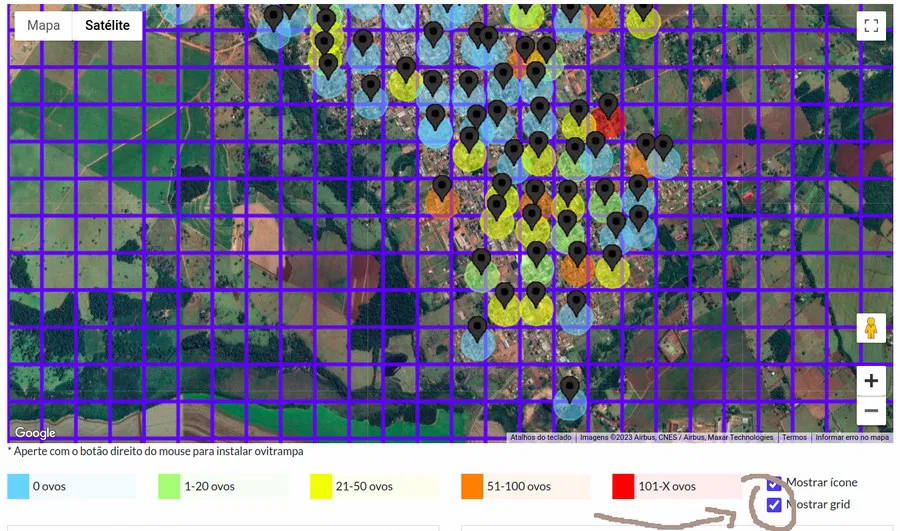
Each ovitrap must respect a distance according to the government's technical note. To help respect the technical note, you can click on show grid. Each square on the Grid must have a maximum of 1 ovitrap.
To facilitate viewing and editing of data, we created some buttons. The first is +filter, where you can filter the ovitraps according to criteria established by you. Each ovitrap on the map is a button in itself, when you click on it a balloon will appear with information about the ovitrap. The balloon will also inform you how you can edit the data seen.
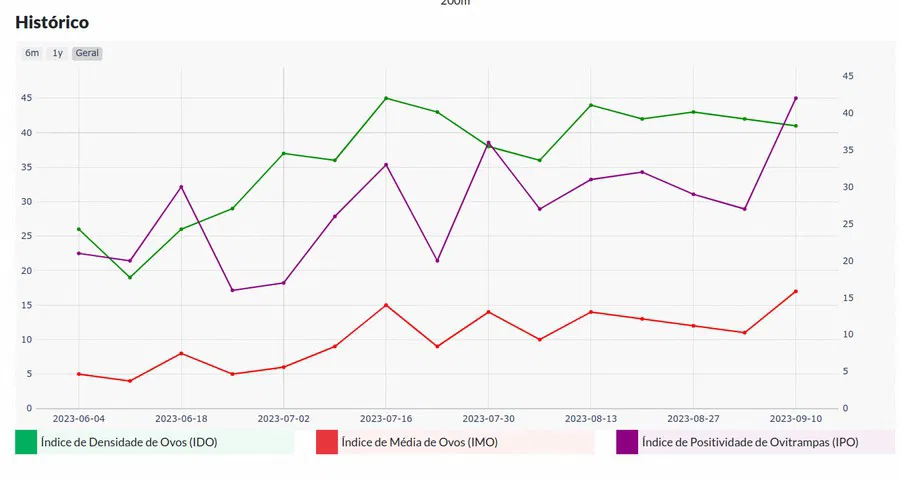
In addition to being able to download ovitrap data, the application creates a history of what has already been done per epidemiological week. An example history can be seen below. With it you can understand whether the actions have been successful or not.